Definition: Karl Pearson’s Coefficient of Correlation is widely used mathematical method wherein the numerical expression is used to calculate the degree and direction of the relationship between linear related variables.
Pearson’s method, popularly known as a Pearsonian Coefficient of Correlation, is the most extensively used quantitative methods in practice. The coefficient of correlation is denoted by “r”.
If the relationship between two variables X and Y is to be ascertained, then the following formula is used:
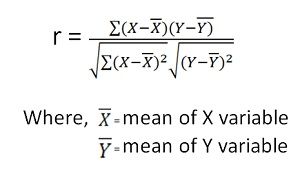 Properties of Coefficient of Correlation
- The value of the coefficient of correlation (r) always lies between ±1. Such as:
r=+1, perfect positive correlation
r=-1, perfect negative correlation
r=0, no correlation - The coefficient of correlation is independent of the origin and scale. By origin, it means subtracting any non-zero constant from the given value of X and Y the vale of “r” remains unchanged. By scale it means, there is no effect on the value of “r” if the value of X and Y is divided or multiplied by any constant.
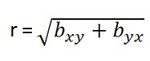
- The coefficient of correlation is a geometric mean of two regression coefficient. Symbolically it is represented as:
- The coefficient of correlation is “ zero” when the variables X and Y are independent. But, however, the converse is not true.
Assumptions of Karl Pearson’s Coefficient of Correlation
- The relationship between the variables is “Linear”, which means when the two variables are plotted, a straight line is formed by the points plotted.
- There are a large number of independent causes that affect the variables under study so as to form a Normal Distribution. Such as, variables like price, demand, supply, etc. are affected by such factors that the normal distribution is formed.
- The variables are independent of each other.
Note: The coefficient of correlation measures not only the magnitude of correlation but also tells the direction. Such as, r = -0.67, which shows correlation is negative because the sign is “-“ and the magnitude is 0.67.
jamilu falgore says
Thanks.
Slim Shady says
Thanks
AHTISHAM MEHRAJ says
thank you, Explanation is written in a way that it looks a story and one wants to keep on going to read and can be understood easily.
Chauhan Vishnusinh says
Awesome
Afshin says
Thank you very much, you done it well.