Definition: The Least Cost Method is another method used to obtain the initial feasible solution for the transportation problem. Here, the allocation begins with the cell which has the minimum cost. The lower cost cells are chosen over the higher-cost cell with the objective to have the least cost of transportation.
The Least Cost Method is considered to produce more optimal results than the North-west Corner because it considers the shipping cost while making the allocation, whereas the North-West corner method only considers the availability and supply requirement and allocation begin with the extreme left corner, irrespective of the shipping cost.
Let’s understand the concept of Least Cost method through a problem given below:
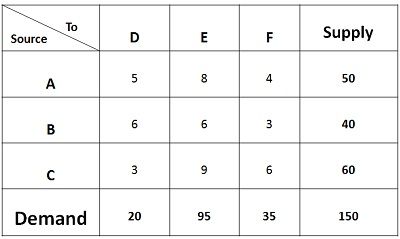
In the given matrix, the supply of each source A, B, C is given Viz. 50units, 40 units, and 60 units respectively. The weekly demand for three retailers D, E, F i.e. 20 units, 95 units and 35 units is given respectively. The shipping cost is given for all the routes.
The minimum transportation cost can be obtained by following the steps given below:
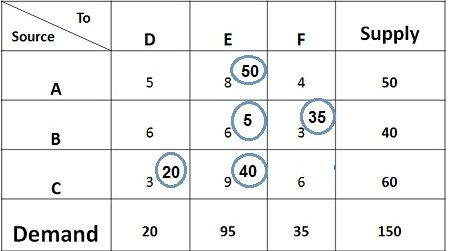
- The minimum cost in the matrix is Rs 3, but there is a tie in the cell BF, and CD, now the question arises in which cell we shall allocate. Generally, the cost where maximum quantity can be assigned should be chosen to obtain the better initial solution. Therefore, 35 units shall be assigned to the cell BF. With this, the demand for retailer F gets fulfilled, and only 5 units are left with the source B.
- Again the minimum cost in the matrix is Rs 3. Therefore, 20 units shall be assigned to the cell CD. With this, the demand of retailer D gets fulfilled. Only 40 units are left with the source C.
- The next minimum cost is Rs 4, but however, the demand for F is completed, we will move to the next minimum cost which is 5. Again, the demand of D is completed. The next minimum cost is 6, and there is a tie between three cells. But however, no units can be assigned to the cells BD and CF as the demand for both the retailers D and F are saturated. So, we shall assign 5 units to Cell BE. With this, the supply of source B gets saturated.
- The next minimum cost is 8, assign 50 units to the cell AE. The supply of source A gets saturated.
- The next minimum cost is Rs 9; we shall assign 40 units to the cell CE. With his both the demand and supply of all the sources and origins gets saturated.
The total cost can be calculated by multiplying the assigned quantity with the concerned cost of the cell. Therefore,
Total Cost = 50*8 + 5*6 + 35*3 +20*3 +40*9 = Rs 955.
Note: The supply and demand should be equal and in case supply are more, the dummy source is added in the table with demand being equal to the difference between supply and demand, and the cost remains zero. Similarly, in case the demand is more than supply, then dummy destination or origin is added to the table with the supply equal to the difference in quantity demanded and supplied and the cost being zero.
Neeraj says
Very nicely explained.
kirubha says
Very nice explain in problem
Ada says
Thank you so much for this!
Hypno says
Thank you
Jermaine says
Thanks for this it was really helpful
Abdulkareem Abdulhammed Abiola says
You absolutely remove my headache
Jane says
Awesome
Aminu Idris Ibrahim says
wonderfully explained
Rishikesh says
This was the best answer!
amber says
Thanks that was more reliable than YouTube videos’.
Matilya says
Well done
richard says
Thank you very nicely explained and easy to follow examples.
Johnson says
The features of Vogels Approximation theory
Hajara Musa Yahaya says
I find it very educative, Thanks a lot.